

How to Use Zabbix to Monitor an Ubuntu Server
Introduction
Zabbix is an open-source software that monitors the availability and performance of IT infrastructure components. Zabbix server can be installed on any Linux distribution.
Zabbix provides real-time monitoring of thousands of metric data that it fetches from servers, virtual machines, network devices, and web applications. Analyzing the data Zabbix gathers will give you a general idea of the health of your servers and web applications, in addition to helping you detect potential problems before your users report them.
Zabbix has several methods for collecting metrics. These include agentless monitoring of user services and client-server architecture.
To monitor a server and collect data from it, Zabbix uses an agent that gathers data from different services and sends it to the Zabbix monitoring server. Zabbix supports encrypted communication between the monitoring server and its monitored clients. This ensures that your data is transferred securely over the network.
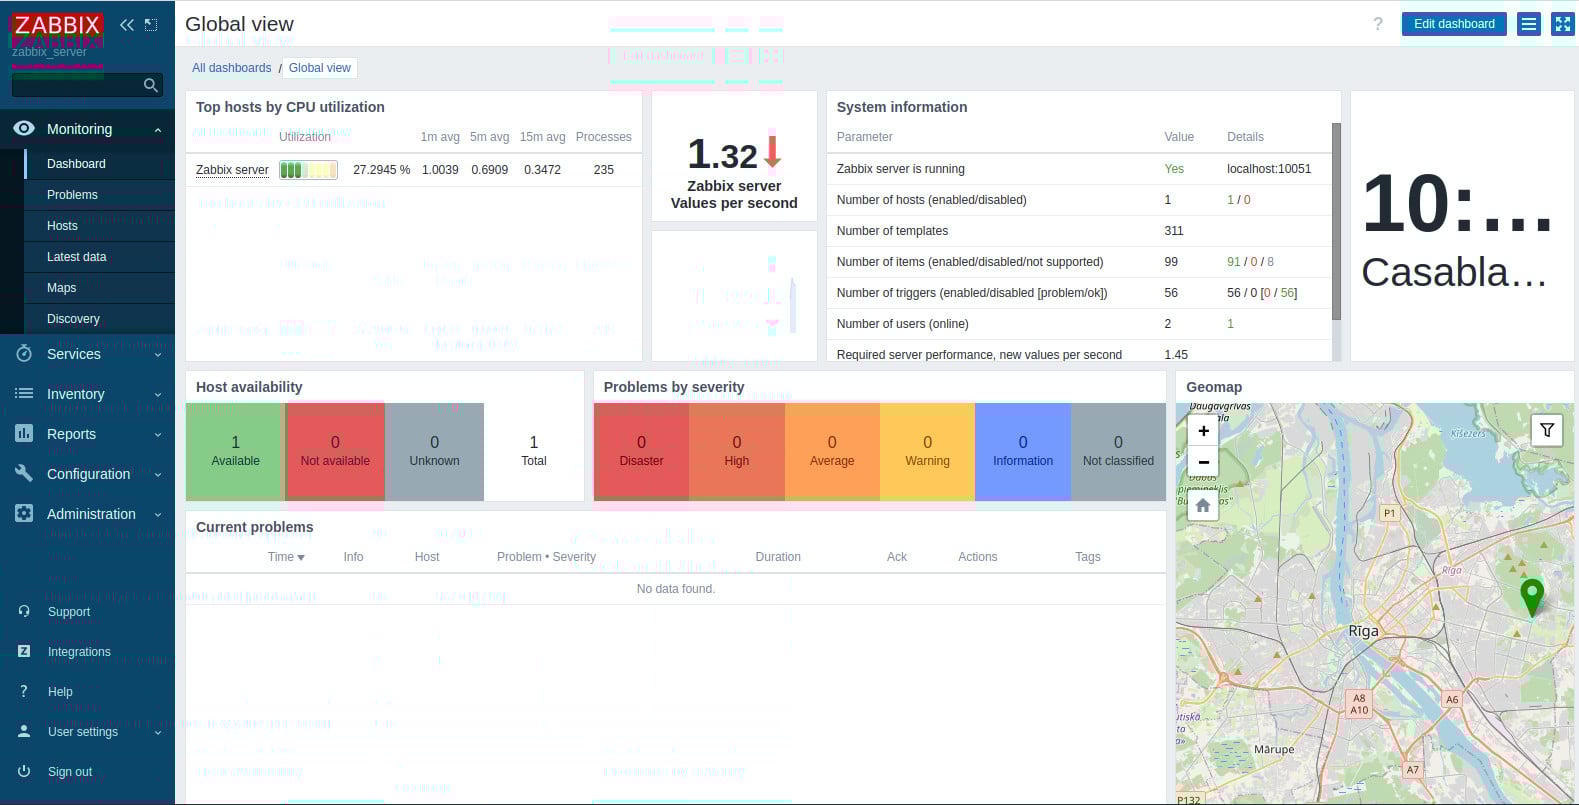
Zabbix provides a web interface that allows you to monitor your servers (also known as Zabbix clients) and their internal services and manage system settings.
In this tutorial, you will install the Zabbix agent on an Ubuntu 22.04 server, and you will use a Zabbix server on another Ubuntu server to monitor it. So that you will have two Ubuntu servers:
- A monitoring server that will have the Zabbix server installed.
- A monitored client that will have the Zabbix agent installed and will be monitored using the Zabbix web interface that's installed on the monitoring server.
Prerequisites
To follow this tutorial you need:
- Basic knowledge of the Linux command line.
- Zabbix installed on your server. See our How to Install Zabbix on Ubuntu 22.04 guide. If you want an Ubuntu server with Zabbix readily installed, Just visit our website, choose the server’s specifications that fit your needs, and while prompted to choose among the operating systems and the 1-Click Applications we have, choose Zabbix from the dropdown menu, complete your checkout, and in a couple of minutes our algorithms will take care of all the technical aspects smoothly and effortlessly, just for you!
- One Ubuntu 22.04 server with a non-root user with
sudoprivileges. This is the server you will monitor using your Zabbix server. You can get affordable, and powerful Ubuntu servers from our website, and you can check out our How to access your server using SSH guide to learn how to access your servers and create asudouser.
Step 1: Installing the Zabbix Agent
To monitor a server using Zabbix, it has to have the Zabbix Agent installed. This agent is a piece of software that gathers monitoring data and sends it to your Zabbix server.
Access the Ubuntu server you wish to monitor using SSH:
ssh your_user@your_server_ip_addressTo download and install the latest Zabbix agent, first get the Zabbix repository configuration package. This can be done by downloading the Zabbix.deb file using the wget command. This .deb file will be used to add the repository.
Run the following command:
wget https://repo.zabbix.com/zabbix/6.2/ubuntu/pool/main/z/zabbix-release/zabbix-release_6.2-2%2Bubuntu22.04_all.debOnce the download finishes, you can install it with the dpkg command:
sudo dpkg -i zabbix-release_6.2-2+ubuntu22.04_all.debNext, update the package index:
sudo apt updateOnce the update finishes, you can move on to installing the Zabbix agent.
Step 2: Installing the Zabbix Agent and Setting up PSK Encryption
To install the Zabbix agent package, run the following command:
sudo apt install zabbix-agentWith this you now have a piece of software that collects monitoring data.
Zabbix supports SSL certificate based encryption. See our Secure Your Site Using HTTPS.
In addition to SSL Encryption, you can also use a pre-shared key (PSK) encryption to protect the connection between the agent and the server.
To set up PSK encryption, first generate a PSK key using openssl:
sudo sh -c "openssl rand -hex 32 > /etc/zabbix/zabbix_agentd.psk"Display the key using cat so you can copy it:
cat /etc/zabbix/zabbix_agentd.pskThe key will look something like this:
Output:
94ac141e6bbbcd92b4bcb65b51e0c29bb07734c46b89c6a68dc55522540f251cSave this key somewhere because you will need it to configure the host on the Zabbix server.
Edit the Zabbix agent settings now to establish a secure connection with the Zabbix server. In your text editor, open the agent configuration file:
sudo nano /etc/zabbix/zabbix_agentd.confEach setting within this file is documented via informative comments throughout the file, but you only need to edit some of them.
You will first need to modify the IP address for the Zabbix server. For this the Server= line is available in the configuration.
Change the default value to the IP address of your Zabbix server.
Server=zabbix_server_ip_addressBy default, Zabbix server automatically connects to the agent. But in some instances, a reverse connection may be required. So, you must specify the Zabbix server name and unique hostname.
Locate the section that configures active checks, and modify the default values:
ServerActive=zabbix_server_ip_address

### Option: Hostname
#       Unique, case sensitive hostname.
#       Required for active checks and must match hostname as configured on the server.
#       Value is acquired from HostnameItem if undefined.
#
# Mandatory: no
# Default:
# Hostname=

Hostname=My ubuntu
Remember to set your Zabbix server's IP address with ServerActive, and set Hostname to a descriptive name for your server.
Next, locate the section that configures secure connections to Zabbix servers and enable pre-shared keys support. Look for the TLSConnect section:
### Option: TLSConnect
# TLSConnect=unencrypted
Then add this line to configure pre-shared key support:
TLSConnect=pskNext, find the TLSAccept section, which looks like this.
### Option: TLSAccept
# TLSAccept=unencrypted
Configure incoming connections to support pre-shared keys by adding this line:
TLSAccept=pskNext, locate the TLSPSKIdentity section, which looks like this:
### Option: TLSPSKIdentity
# TLSPSKIdentity=
Choose a unique name to identify your pre-shared key by adding this line:
TLSPSKIdentity=PSK 001This will be used as your PSK ID to add your host via the Zabbix web interface.
Next, set the option to point to your pre-shared keys. Find the TLSPSKFile option:
### Option: TLSPSKFile
#       Full pathname of a file containing the pre-shared key.
#
# Mandatory: no
# Default:
# TLSPSKFile=
Add this line to point the Zabbix agent to your PSK file you created earlier:
TLSPSKFile=/etc/zabbix/zabbix_agentd.pskSave and close the file. You can now restart the Zabbix agent and tell it to start at boot time.
sudo systemctl restart zabbix-agent

sudo systemctl enable zabbix-agent
Use systemctl status to check that the Zabbix agent is running properly:
sudo systemctl status zabbix-agentYou will see the following output, indicating the agent is active and running:
● zabbix-agent.service - Zabbix Agent
     Loaded: loaded (/lib/systemd/system/zabbix-agent.service; enabled; vendor preset>
     Active: active (running) since Sat 2022-09-24 01:47:00 IST; 9s ago
The Zabbix agent will listen on port 10050 for connections from the Zabbix server. If you have a firewall configured, allow connections to this port, using UFW:
sudo ufw allow 10050/tcpNow your agent can send data to Zabbix. To complete the monitoring configuration, you now need to link your monitored server with the Zabbix monitoring server using the Zabbix web interface. Which is what you'll do in the next step.
Step 3: Adding the New Host to the Zabbix Server
With the Zabbix agent installed on your server. You will now need to register it as a host that you wish to monitor with the Zabbix server. This can be done through the web interface.
Log in to your Zabbix Server web interface by navigating to the following address with your browser:
http://your_zabbix_server_domain_or_ip:8080Login with your Zabbix web interface credentials.
After you log in, click Configuration on the lefthand menu and then Hosts. Then, click on the Create host button at the top right of the screen. This will open the host configuration webpage.
In the Hostname field, type in the host name of the server you wish to monitor.
Add the host to a group. You can either select an existing group (for example Linux servers) or create your own. You can have multiple hosts. Enter the name of a group you are interested in joining in the Groups field. Then, select the value you want from the list.
In our case, type in Linux servers in the hosts group, wait for a list to appear, then select it from the list to add it as a group to the host.
In the Templates field. Type in Linux by Zabbix agent, wait for a list to appear, then select it from the list to add it as a template to the host. Using the same process, type in Zabbix server health and add it as a another template.
In the Interfaces field, click Add, then select Agent. Then type in the IP address of the server you wish to monitor.
Next, click on the Encryption tab. Choose PSK for both Connections from host and Connections to host.
Next, set PSK identity as PSK 001. This is the value of the TLSPSKIdentity that you previously configured for the Zabbix agent.
Next, set up the PSK value as the key that you created for the Zabbix Agent. It's the one stored in the file /etc/zabbix/zabbix_agentd.psk on the agent Ubuntu machine.
Finally, click the Add button at the bottom of the form to add the server as a host.
Your new host will be listed in the Zabbix web interface. If it doesn't immediately appear, wait a moment and then reload the page.
With this, you now have a Zabbix server that monitors another server.
To monitor your server, click Monitoring on the lefthand menu, then Hosts, then select your monitored host in the list of hosts. You'll be given a few options so you can choose what type of monitoring you wish to perform.
Congrats!
You've learned how to monitor a Linux server using Zabbix. If you have any other servers to monitor, you can follow these same steps: Log in to each host, install the Zabbix agent, generate a PSK, configure the agent, and add the host to the web interface following the same steps you followed to add your first host.
Check out the official documentation to learn more about the capabilities of Zabbix.
A note about tutorials: We encourage our users to try out tutorials, but they aren't fully supported by our team—we can't always provide support when things go wrong. Be sure to check which OS and version it was tested with before you proceed.
If you want a fully managed experience, with dedicated support for any application you might want to run, contact us for more information.