
Is your Grafana dashboard still running on unencrypted HTTP? Without secure HTTPS, you're exposing sensitive metrics, dashboards, and login credentials to potential attackers every time someone accesses your instance.
But don’t worry, with Let's Encrypt, you can enable HTTPS on Grafana to protect your sensitive metrics and user credentials, all for free.
In this comprehensive guide, I will walk you through the entire process of securing your Grafana instance with free SSL certificates from Let's Encrypt.
Enable HTTPS in Grafana Using Let's Encrypt SSL Certificates - Overview
To enable HTTPS in Grafana with Let's Encrypt, you’ll first install Certbot, use it to generate a certificate, then stop the Grafana server so that you can modify the configuration file to use the HTTPS protocol. Finally you’ll restart the service to apply changes. The entire process takes about 10 minutes and provides immediate protection with automatic certificate renewal.
Why Secure Your Grafana Dashboard with HTTPS?
When accessing Grafana through the web, unencrypted HTTP connections expose sensitive information including:
- Login credentials
- API keys
- Visualization data and metrics
By enabling HTTPS with Let's Encrypt certificates, you ensure that all communication between users and your Grafana instance is encrypted, preventing potential eavesdropping and man-in-the-middle attacks.
Prerequisites for Installing Let's Encrypt on Grafana
Before you proceed with installing Let's Encrypt, you'll need:
- A domain name. You can purchase one directly from your SSD Nodes dashboard, where you will be able to manage it efficiently.
- Grafana installed on your VPS.
To get a reliable Linux VPS with Grafana pre-installed, go to our homepage, choose a server of your choice from one of our affordable VPS hosting servers and click Customize Your Server:
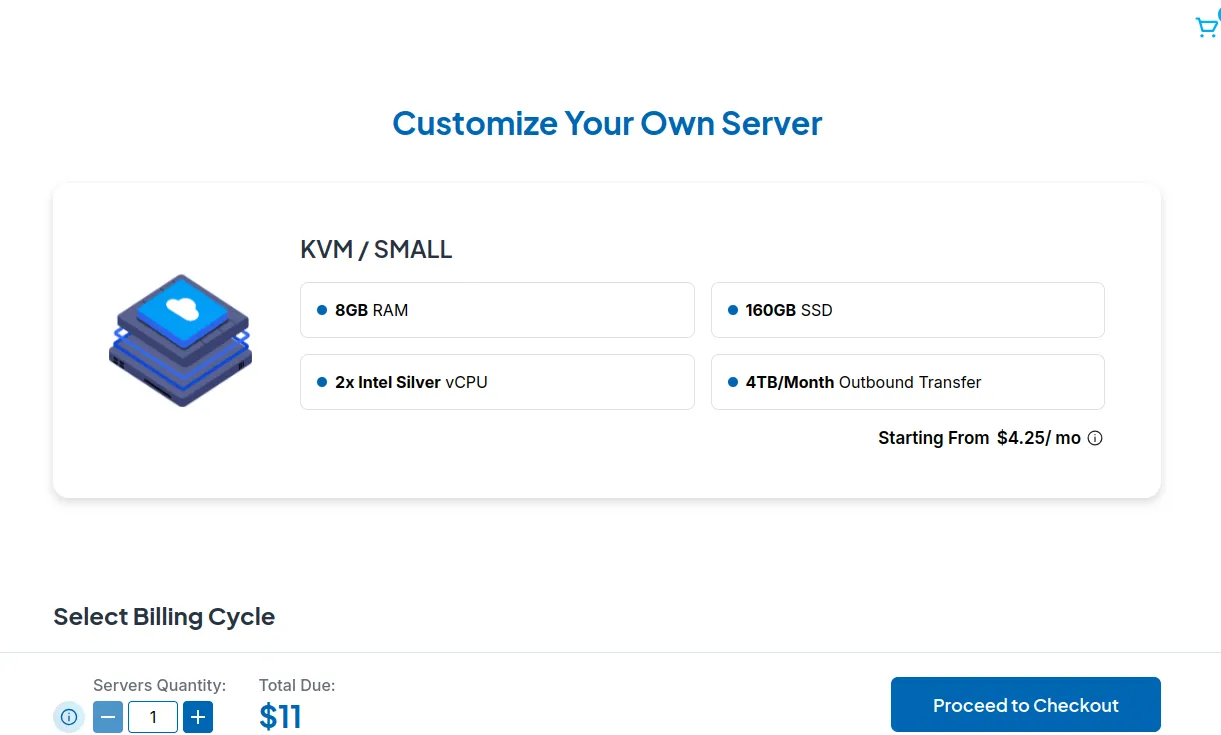
Select a suitable location from our 14 locations worldwide, then under Select Server Image = > Apps, choose Grafana, then proceed to checkout:
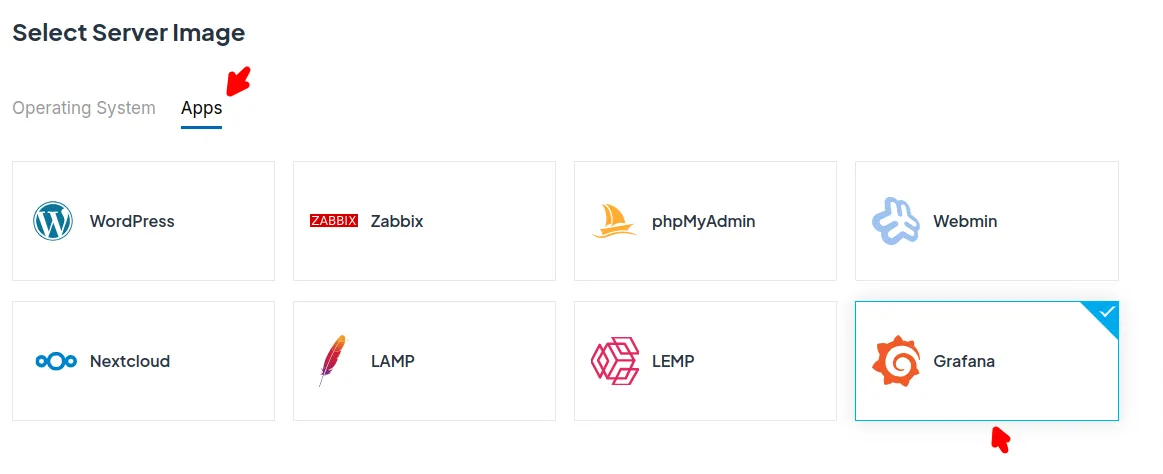
And congratulations! You'll have Grafana installed on your VPS in less than 5 minutes.
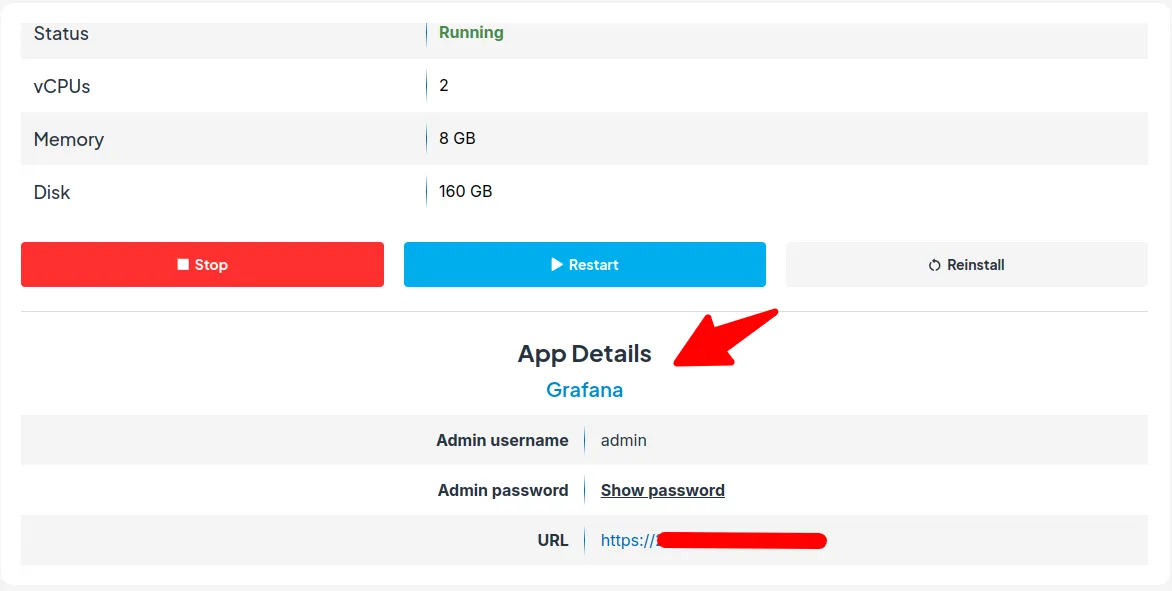
To access Grafana, use the URL in the App Details section in your SSD Nodes dashboard:
Deploy Your Grafana VPS With Us And Save $5000+
Did you know that we are the most affordable VPS provider in the market? You can save up to $5000 with us over three years. Check out the SSD Nodes hosting pricing page, and stop overpaying for your VPS.
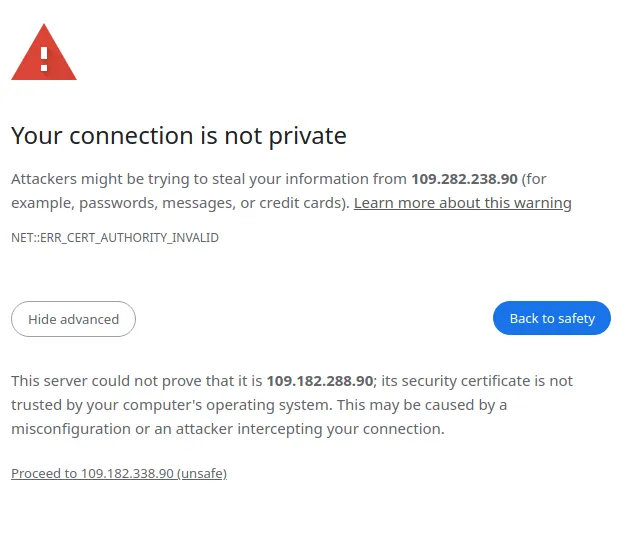
When you first access Grafana, your browser will show a security warning because Grafana uses a self-signed SSL certificate by default. We'll fix this warning by installing a trusted Let's Encrypt certificate in the next steps. For now, just click "Advanced" or "More Information" in your browser, then "Proceed" to continue to the login page:
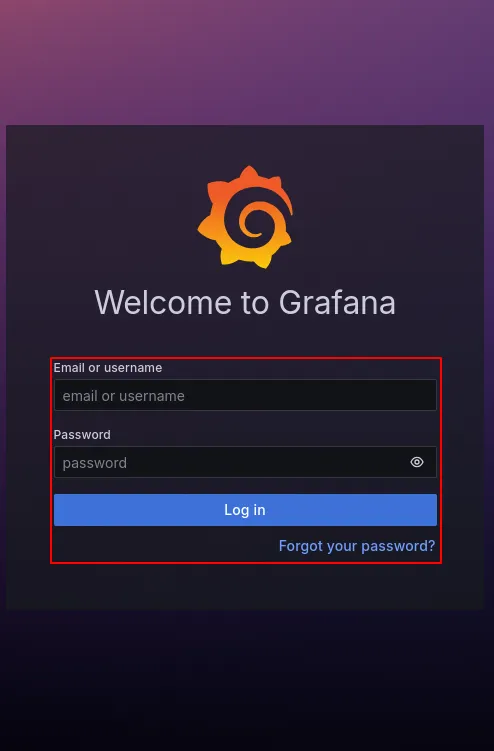
Once you proceed, you'll have access to the Grafana login page:
With Grafana now installed on your VPS, you can move on to installing Let's Encrypt on it for better HTTPS security. I will cover a simple way of doing this in the next few sections.
1. Installing Let's Encrypt Client (Certbot)
Note: The steps in this tutorials are for a Debian-based Linux systems. For other distros, check out Certbot documentation.
Let's Encrypt provides free, automated SSL certificates through a tool called Certbot. Let's install it first:
sudo apt install -y certbotThis command installs the Certbot client, which will handle certificate generation and renewal.
2. Obtaining a Let's Encrypt SSL Certificate
Now that Certbot is installed, we'll use it to obtain an SSL certificate:
sudo certbot certonly --standaloneThe --standalone option tells Certbot to use its own web server to verify domain ownership.
You will need to answer several prompts:
1. (Your email)            # For renewal notifications
2. (Y)                     # Agree to Let's Encrypt terms of service
3. (N)                     # (optional) Decline to share email with EFF
4. your_domain.com         # Your domain name for the certificate
After successful verification, you'll receive a message confirming that your certificate has been generated:
Successfully received certificate.
Certificate is saved at: /etc/letsencrypt/live/your_domain.com/fullchain.pem
Key is saved at:         /etc/letsencrypt/live/your_domain.com/privkey.pem
This certificate expires on 2025-06-05.
These files will be updated when the certificate renews.
Certbot has set up a scheduled task to automatically renew this certificate in the background.
Let's Encrypt generates two important files:
- The private key:
/etc/letsencrypt/live/your_domain.com/privkey.pem - The certificate file:
/etc/letsencrypt/live/your_domain.com/fullchain.pem
These two files form the foundation of your SSL/TLS security:
- Private Key (
privkey.pem): This is the secret component that should never be shared or exposed. It's used to decrypt traffic that was encrypted with your public key. Think of it as the unique key to your secure vault. If this key is compromised, an attacker could potentially intercept and decrypt your encrypted traffic. - Certificate File (
fullchain.pem): This contains two important components bundled together:- Your server's certificate (containing your public key)
- The Let's Encrypt certificate authority chain
The fullchain.pem file allows browsers to verify that your certificate was issued by a trusted authority (Let's Encrypt) and establish an encrypted connection. Using the complete chain rather than just the certificate alone prevents browser warnings about untrusted certificates.
3. Configuring Grafana to Use Let's Encrypt Certificates
Now that we have our SSL certificate, we need to configure Grafana to use it.
Step 1: Stop the Grafana Server
First, stop the Grafana service to safely make changes:
sudo systemctl stop grafana-serverStep 2: Back Up Existing Certificates
You will likely already have existing self-signed certificates generated by Grafana. It is a good idea to back them up by renaming them:
sudo mv /etc/grafana/grafana.key /etc/grafana/grafana_old.key
sudo mv /etc/grafana/grafana.pem /etc/grafana/grafana_old.pem
Step 3: Create Symlinks to Let's Encrypt Certificates
Set up symbolic links for Grafana to use the Let's Encrypt certificates you generated earlier:
sudo ln -s /etc/letsencrypt/live/your_domain.com/fullchain.pem /etc/grafana/grafana.pem
sudo ln -s /etc/letsencrypt/live/your_domain.com/privkey.pem /etc/grafana/grafana.key
Using symlinks means that when Let's Encrypt automatically renews your certificates, Grafana will always use the latest ones without you having to do any manual intervention.
Step 4: Adjust File Permissions
Grafana runs under the grafana group and needs proper permissions to read the certificate files:
sudo chgrp -R grafana /etc/letsencrypt/*
sudo chmod -R g+rx /etc/letsencrypt/*
sudo chown -R grafana /etc/letsencrypt/*
sudo chown grafana /etc/grafana/*
sudo chgrp -R grafana /etc/grafana/grafana.pem /etc/grafana/grafana.key
sudo chmod 400 /etc/grafana/grafana.pem /etc/grafana/grafana.key
These commands ensure that the Grafana service has appropriate read permissions while maintaining security for the certificate files.
Step 5: Verify Permissions
Confirm that the permissions are set correctly:
ls -l /etc/grafana/grafana.*You should see output similar to this:
-rw-r----- 1 grafana grafana 81810 Mar  7 23:10 /etc/grafana/grafana.ini
lrwxrwxrwx 1 root    grafana    50 Mar  7 23:50 /etc/grafana/grafana.key -> /etc/letsencrypt/live/test.adyouri.com/privkey.pem
lrwxrwxrwx 1 root    grafana    52 Mar  7 23:50 /etc/grafana/grafana.pem -> /etc/letsencrypt/live/test.adyouri.com/fullchain.pem
4. Modifying Grafana Configuration for HTTPS
Now that you’ve generated the Let’s Encrypt certificate and adjusted permissions, you need to update Grafana's configuration to use HTTPS.
Step 1: Edit the Grafana Configuration File
Open the Grafana configuration file:
sudo nano /etc/grafana/grafana.iniStep 2: Update Server Settings
Locate the [server] section and modify these parameters:
[server]
# Protocol (http, https, h2, socket)
protocol = https

# The http port to use
http_port = 3000

# The domain name to use
domain = your_domain.com

# Set to true to enforce domain validation
enforce_domain = true

# Path to the certificate file
cert_file = /etc/grafana/grafana.pem

# Path to the private key file
cert_key = /etc/grafana/grafana.key
Save the file and exit the editor.
5. Restarting and Testing Secure Grafana
Step 1: Restart Grafana
Restart the Grafana service to apply all the changes:
sudo systemctl restart grafana-serverStep 2: Verify Grafana Service Status
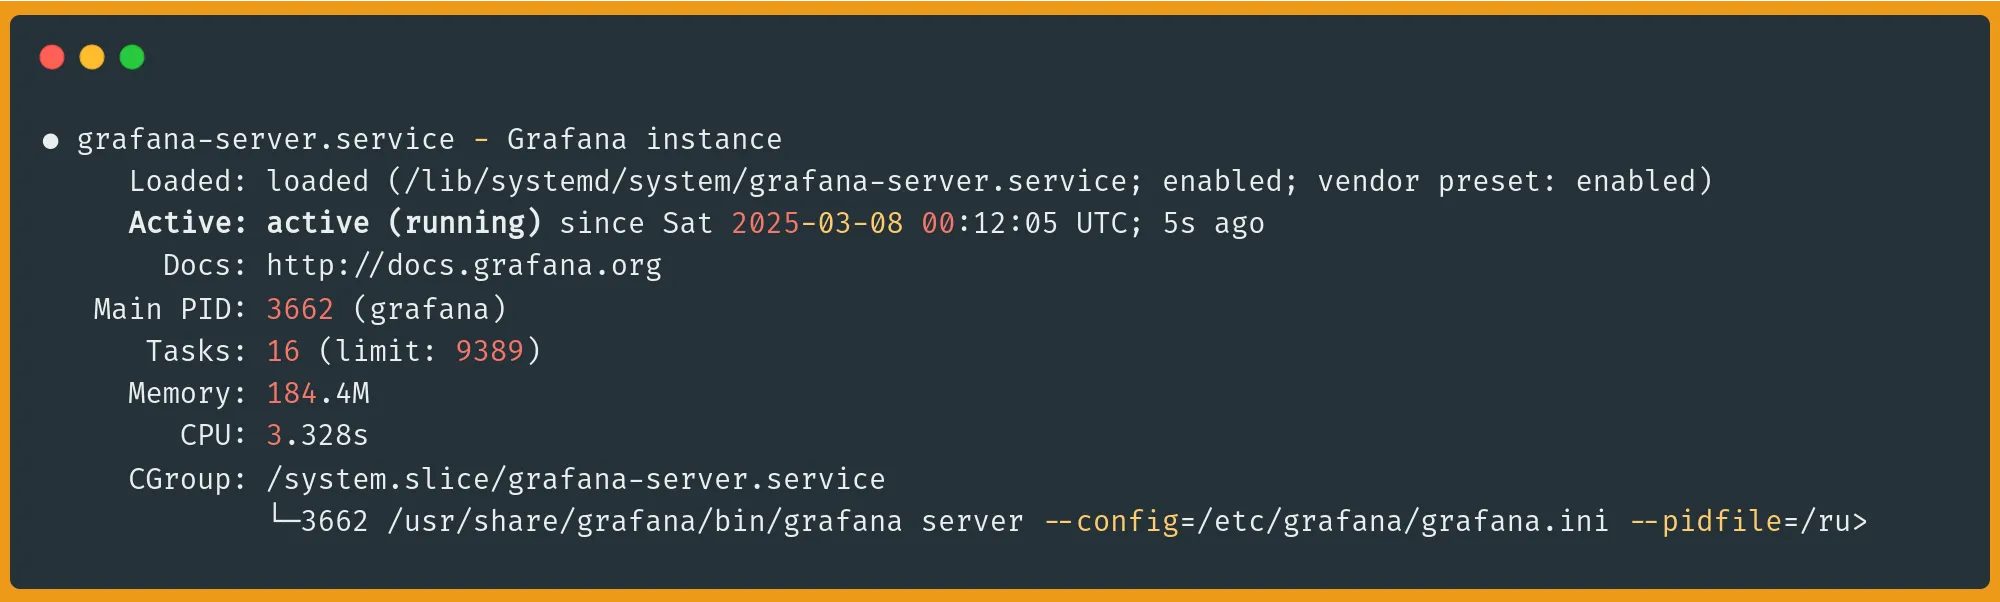
Check that Grafana started successfully:
sudo systemctl status grafana-serverLook for "Active: active (running)" in the output to confirm that Grafana is running properly:
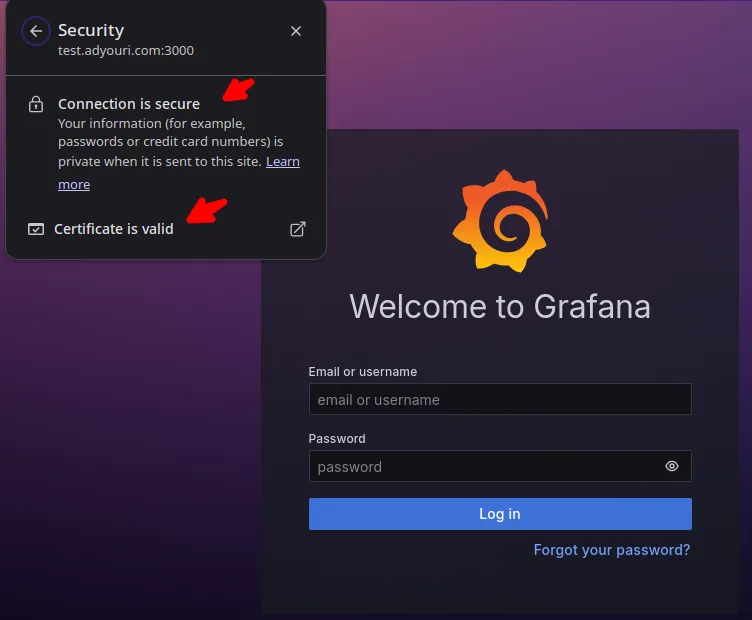
Step 3: Access The Secure Grafana Dashboard
Open your browser and navigate to your Grafana dashboard via HTTPS:
https://your_domain.com:3000/You should now see that the Grafana login page loads with a secure HTTPS connection, indicated by a Connection is secure message in your browser's address bar settings.
6. Certificate Auto-renewal Setup
Let's Encrypt certificates are valid for 90 days. However, the good news is that Certbot automatically uses a renewal service to handle the process of renewing certificates before they expire. In this section, you’ll verify and test this feature.
Verify Auto-renewal Configuration
To check that the automatic renewal is configured correctly, run:
sudo systemctl list-timers | grep certbotYou should see a scheduled timer for the renewal process.
Test Certificate Renewal
You can test the renewal process without actually renewing the certificate:
sudo certbot renew --dry-runIf this is successfully executed, you'll see a message indicating that the renewal was simulated with no issues:
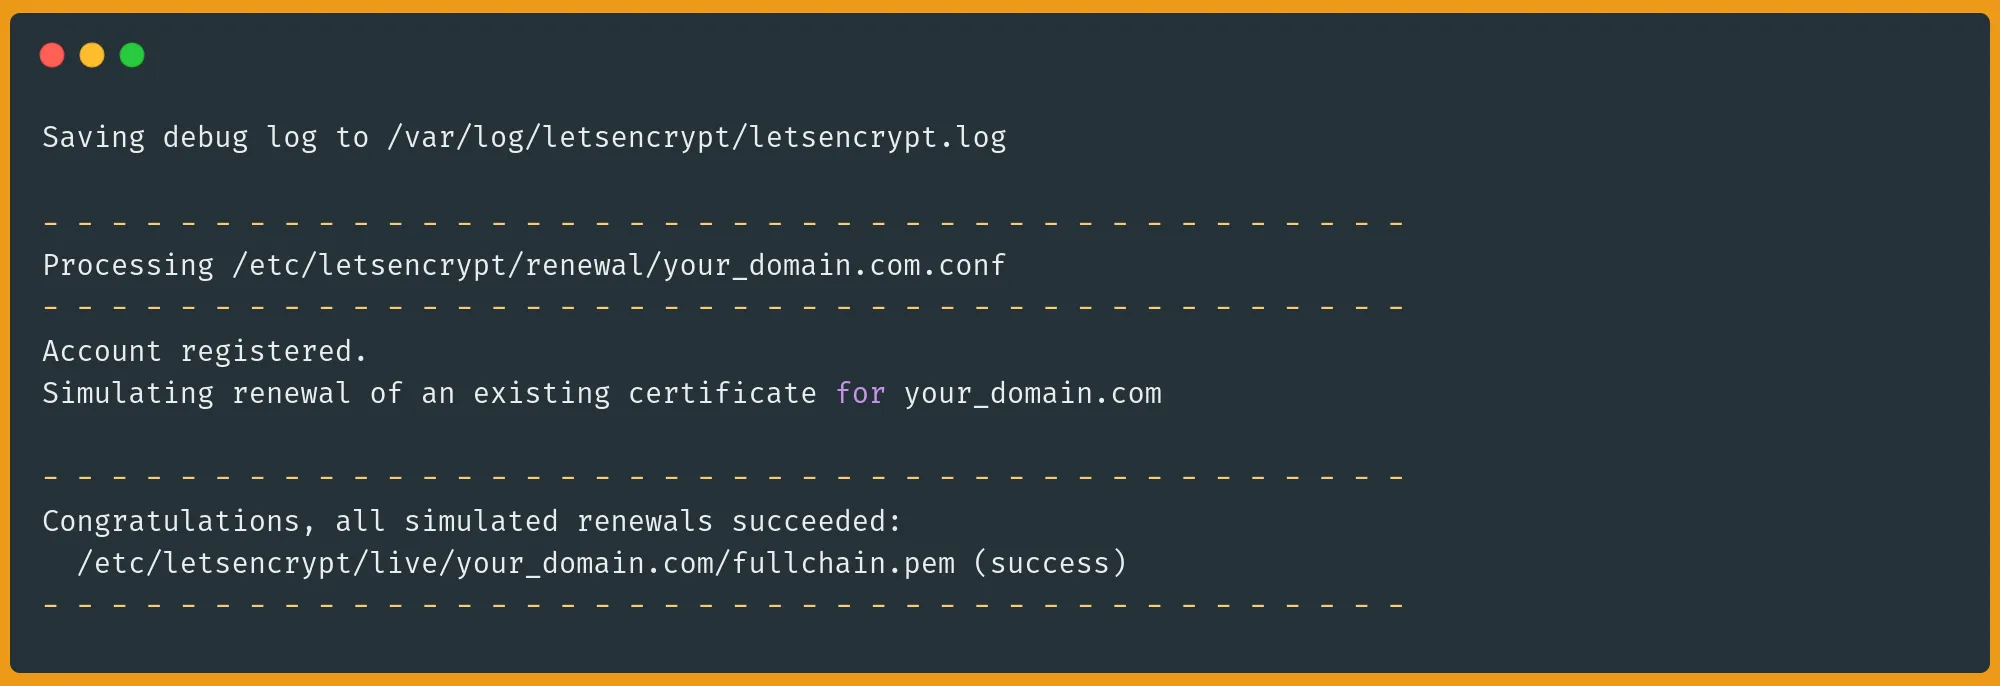
With this, we’ve covered everything you need to enable HTTPS in Grafana with Let's Encrypt SSL Certificates. If you are facing any issues with your setup, please re-check all the previous instructions, and refer to the next section for troubleshooting common issues.
Troubleshooting Common Issues
Problem: Grafana Fails to Start
If Grafana fails to start after configuring HTTPS, check the logs:
sudo journalctl -u grafana-server -fThe most common issues to look for are:
- Permission denied errors: Review the file permissions for certificate files.
- Cannot find certificate: Verify symlink paths are correct.
- Address already in use: Another service might be using the configured port (The default
3000or any port you specified in the configuration file).
Problem: Certificate Not Trusted by Browser
If your browser shows security warnings, make sure you're using the full chain certificate (fullchain.pem) rather than just the certificate (cert.pem).
Problem: Certificate Renewal Failures
If automatic renewals fail, ensure that:
- Port
80is accessible when renewal occurs. - The Certbot timer service is enabled and running.
- Certbot has sufficient permissions to write to the certificate directories.
Conclusion
Congratulations! You've successfully secured your Grafana instance with free Let's Encrypt SSL certificates. Your dashboard is now protected with industry-standard encryption, ensuring that all data transmitted between users and your Grafana server remains private and secure.
By enabling HTTPS for Grafana, you've:
- Protected user credentials during login
- Secured sensitive metrics data in transit
- Ensured the integrity of your dashboard communications
- Improved overall security posture with minimal cost
For those looking to use Grafana for game server monitoring or statistics, consider using a Gaming VPS that provides the performance needed for both your game servers and monitoring tools.
Regularly check for Grafana updates and security patches to keep your monitoring infrastructure secure and running smoothly. For more information on Granafa, checkout the official documentation.
FAQ
What is Grafana's default port?
Grafana uses port 3000 by default for both HTTP and HTTPS connections. This is defined in the Grafana configuration file. While you can change this to the standard HTTPS port 443, using port 3000 means you don't need special privileges to bind to lower-numbered ports, and it avoids potential conflicts with other web services that typically use port 443.
How do I access Grafana after enabling HTTPS?
After enabling HTTPS, you can access Grafana by entering https://your_domain.com:3000 in your web browser. Note that you must use "https://" and include the port number unless you've configured Grafana to use standard port 443. If you're using a self-signed certificate initially, you might need to accept a security warning in your browser.
A note about tutorials: We encourage our users to try out tutorials, but they aren't fully supported by our team—we can't always provide support when things go wrong. Be sure to check which OS and version it was tested with before you proceed.
If you want a fully managed experience, with dedicated support for any application you might want to run, contact us for more information.