

Looking to install Grafana on Ubuntu 24.04, and you want a simple tutorial? You're in the right place. I'll walk you through everything you need to install and configure on your server to have Grafana up and running.
Grafana is an open-source monitoring and data visualization software. It provides analytics and interactive visualization on the web for your servers, with features offering charts, graphs, and alerts. It supports integration with complex data sources such as Prometheus, Graphite, and ElasticSearch.

This tutorial will guide you through installing and configuring Grafana on your Ubuntu server.
Installing Grafana on Ubuntu 24.04
To install Grafana on Ubuntu 24.04, you'll first update the package index, add Grafana's APT repository, install it, then enable it to start automatically after system startup. Finally, you'll secure your installation by disabling signups and anonymous access.
Note
If you want to skip all the technical steps of setting up Grafana on your server and have it installed in minutes, then I have some great news for you! Our team of engineers has prepared a ready-to-use 1-click Grafana application for your convenience. Just choose a server, and while prompted to choose the operating system, choose Grafana from the dropdown menu. This will set up Grafana in minutes! However, if you want to get your hands dirty, then you can continue reading.
Prerequisites
To follow this tutorial you need:
- Basic knowledge of the Linux command line.
- An Ubuntu 24.04 server with a non-root user with
sudoprivileges. If you haven't noticed, we offer extremely powerful Ubuntu servers at the globe's absolute lowest price. Take a look at our offerings and prepare for your mind to be blown 🤯. - The LEMP stack (Nginx, MariaDB, and PHP) installed on your server. Use our Installing LEMP on Ubuntu 24.04 LTS guide to set it up, or you can simply use our LEMP 1-Click App to set up LEMP automatically when creating a server with SSD Nodes.
- A TLS/SSL certificate, because Grafana can access sensitive information about your infrastructure. Fun fact: All our 1-click applications (including LEMP and Grafana) come preinstalled with an SSL certificate 🙂
Check out our How to access your server using SSH guide to learn how to access your server and create a sudo user.
Step 1: Updating the Ubuntu Package List
Start by updating the packages in the package manager cache to the latest available versions using the following command:
sudo apt update
Step 2: Install Grafana on Ubuntu Server
To install Grafana, you will need to first add its APT repository. First get the official GPG key from the Grafana website using the following command:
wget -q -O - https://packages.grafana.com/gpg.key | gpg --dearmor | sudo tee /usr/share/keyrings/grafana.gpg > /dev/nullThis downloads and stores the key in /usr/share/keyrings/grafana.gpg.
With the GPG key downloaded, add the Grafana repository to your APT sources using the following command:
echo "deb [signed-by=/usr/share/keyrings/grafana.gpg] https://packages.grafana.com/oss/deb stable main" | sudo tee -a /etc/apt/sources.list.d/grafana.listTo use the repository, update the package index of your Ubuntu server:
sudo apt updateOnce the update is done, install Grafana with the following command:
sudo apt install grafana
Once the installation finishes, start the Grafana server:
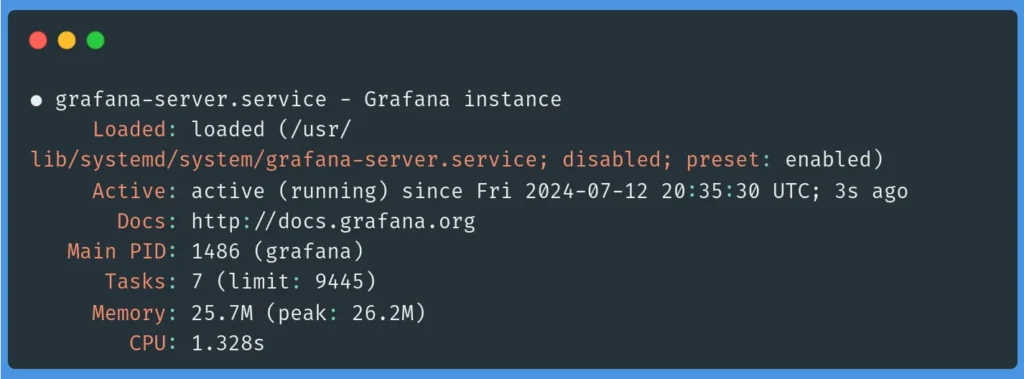
sudo systemctl start grafana-serverOnce started, check the Grafana server status with the systemctl status command:
sudo systemctl status grafana-serverYou will receive the following output:
Next, enable the Grafana server to start at boot:
sudo systemctl enable grafana-serverYou should receive the following output:
Synchronizing state of grafana-server.service with SysV service script with /lib/systemd/systemd-sysv-install.
Executing: /lib/systemd/systemd-sysv-install enable grafana-server
Created symlink /etc/systemd/system/multi-user.target.wants/grafana-server.service → /lib/systemd/system/grafana-server.service.
With this, Grafana is now successfully installed on your server.
Step 3: Logging in to Grafana
Now that you have Grafana installed on your server, you can visit the following URL to access the Grafana web interface:
http://your_server_IP_or_domain:3000Remember to change your_server_IP_or_domain with your server's IP address or domain name.
Once the page loads, you will see a login screen as follows:
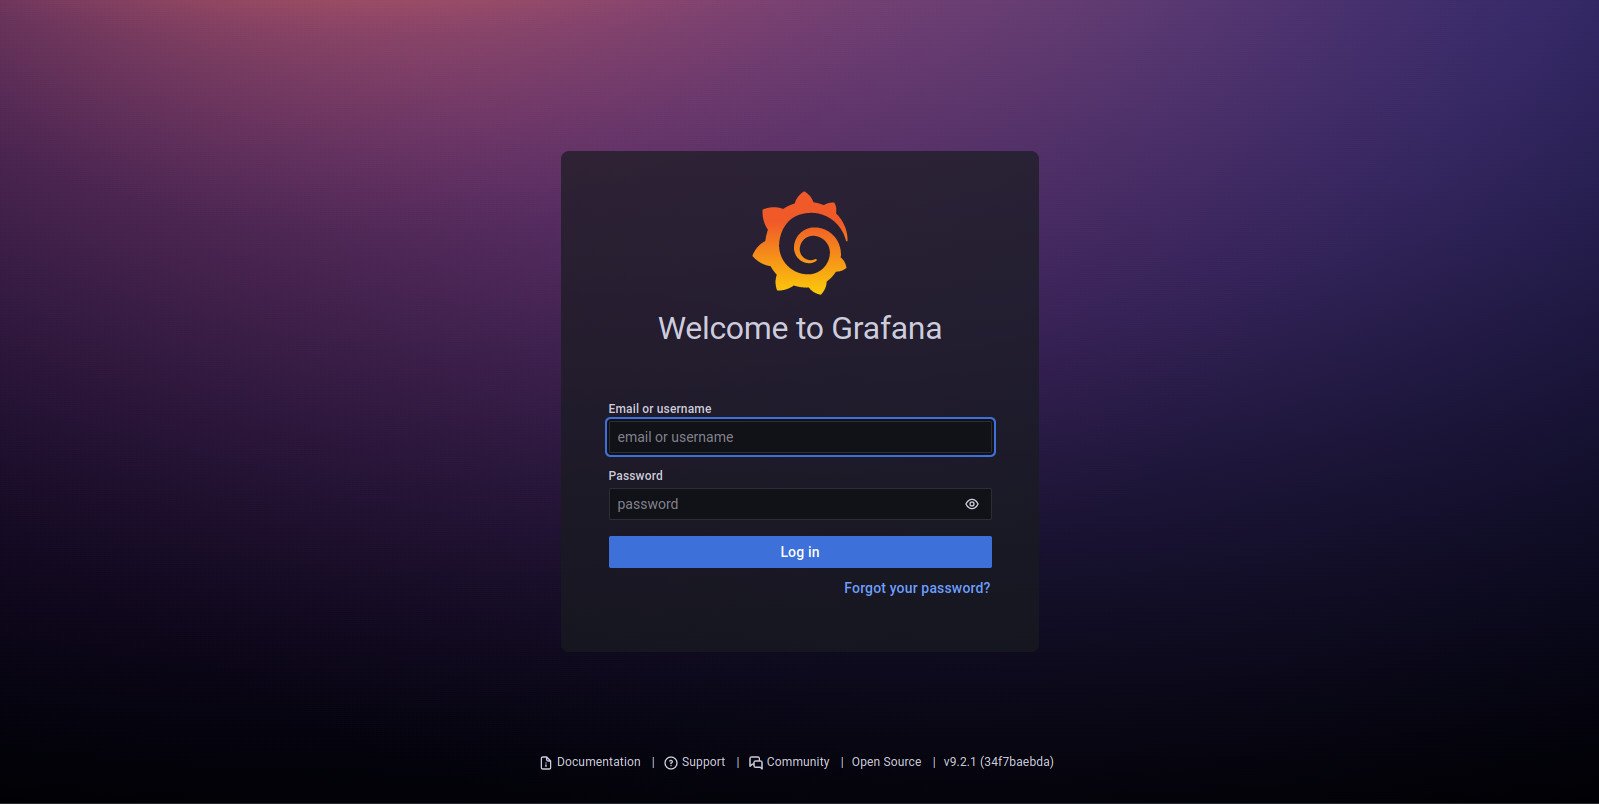
The default Grafana credentials are admin for the username and admin for the password. Once you enter these credentials and submit the form, you will be moved to a screen with a form for entering a new password for your admin account. Enter a strong password, re-enter it, and submit the form.
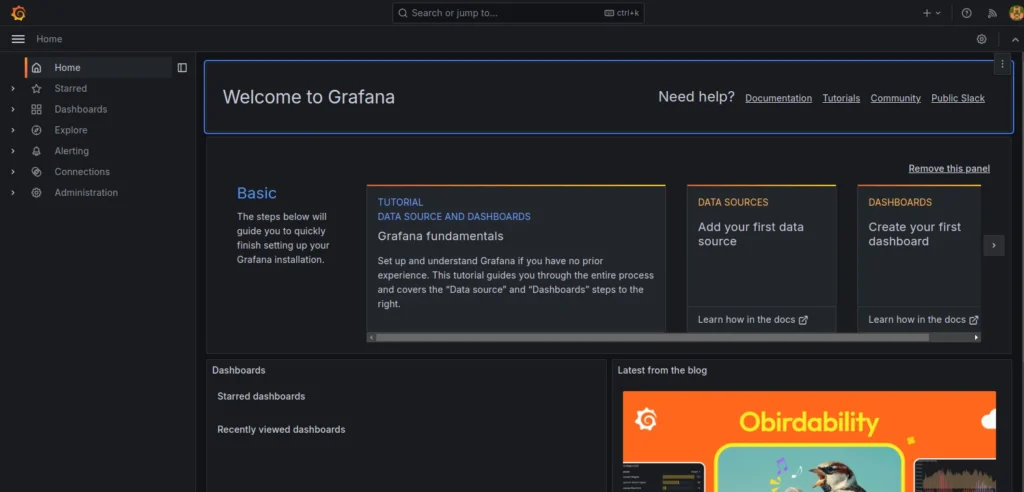
Once you secure your account, you'll be redirected to the Grafana dashboard.
Step 4: Disabling Grafana Signups and Anonymous Access
To further secure your Grafana set up, you need to disable an option that allows visitors to create user accounts and access the Grafana dashboard.
First, open Grafana's main configuration file:
sudo nano /etc/grafana/grafana.iniChange the allow_sign_up directive from this:
# disable user signup / registration
;allow_sign_up = true
To the following:
# disable user signup / registration
allow_sign_up = false
Next, disable anonymous access. First, look for the following:
# enable anonymous access
;enabled = false
And change it to the following:
# enable anonymous access
enabled = false
This limits dashboard access to registered users only.
Save and close the file.
Restart Grafana:
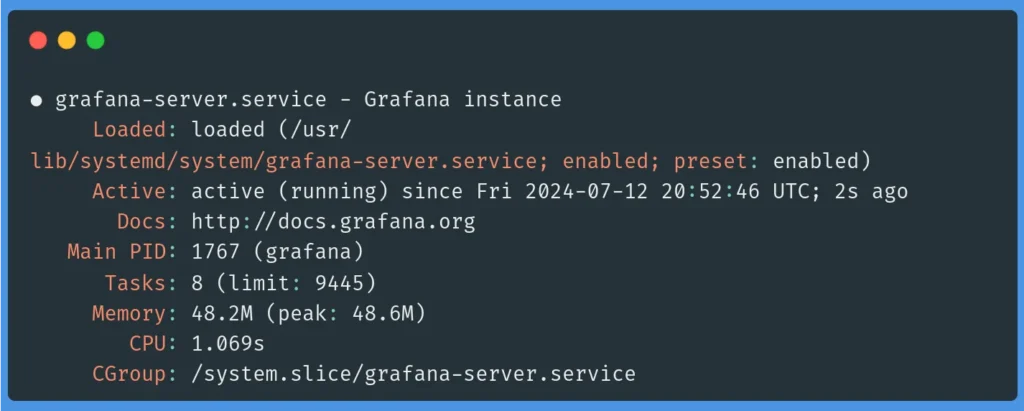
sudo systemctl restart grafana-serverCheck the status of the Grafana server:
sudo systemctl status grafana-serverThe output should be as follows:
To verify that registrations have been disabled, visit your Grafana web interface like before:
http://your_server_IP_or_domain:3000Move your cursor to the admin avatar on the lower-left of the screen directly above the question mark, then click Sign out.
Once your signed out, check that there is no Sign Up button on the page.
With this, the Grafana dashboard is now only accessible via accounts you register.
You've successfully installed Grafana on your Ubuntu 24.04 server, and you can now monitor your server. For more information on Grafana, check out their official website.
Note: What we’ve done in this article is suitable for testing purposes and personal use, whereas if you want to publish your site to production, and securely process your online transactions, we do suggest you check our How To Install Let’s Encrypt on Ubuntu 24.04 article, that explains in detail how to secure your site with SSL certificates
Reader Alert!
If you feel that the technical instructions in this tutorial are time-consuming, or beyond your expertise, you can choose a very convenient and practical solution, ready-made, fully and professionally tested, and developed by SSD Nodes (That is us 😊). Just visit our website, choose the server’s specifications that fit your needs, and while prompted to choose among the operating systems and the 1-Click Applications we have, choose Grafana from the Apps menu, complete your checkout, and in a couple of minutes our algorithms will take care of all the technical aspects smoothly and effortlessly, just for you!
FAQ: Frequently Asked Questions on Grafana
What is Grafana Playground?
Grafana Playground is a free, interactive environment for exploring Grafana features and capabilities without installation. It allows users to experiment with dashboards, data sources, and visualization options in real-time. This is ideal for learning and testing. Grafana Playground helps users understand how to leverage Grafana for monitoring and data analytics effectively. Try it today to enhance your skills!
How to Use HTTPS with Grafana?
Using HTTPS with Grafana enhances security by encrypting data transmission. Learn to set it up using Let's Encrypt and Certbot with our How To Install Let’s Encrypt on Ubuntu 24.04 tutorial.
What is the Difference Between Grafana vs Superset?
While both Grafana and Apache Superset are powerful data visualization tools, they cater to different needs. Grafana is ideal for real-time monitoring and observability, excelling with time-series data and providing robust alerting features. It's commonly used for tracking system health and application performance. In contrast, Apache Superset is geared towards business intelligence and data exploration, offering powerful tools for creating interactive dashboards and conducting SQL-based analytics.
A note about tutorials: We encourage our users to try out tutorials, but they aren't fully supported by our team—we can't always provide support when things go wrong. Be sure to check which OS and version it was tested with before you proceed.
If you want a fully managed experience, with dedicated support for any application you might want to run, contact us for more information.